создание и объединение двух участков-линейный участок xy с участком столбчатой цепи в R
Следующие два набора данных, из которых я намерен создать граф:
Первые данные (будет развиваться нижняя часть)
position <- c(10, 26, 31, 50, 73, 92, 120, 124)  # need scale
    minimum 0 to maximum 130
label <- c("A", "B", "C", "D", "E", "F", "G", "H")
mydf <- data.frame (position, label)
Вторые данные (разовьет линейный график поверх проложенного)
pos <- 1:130
value <- seq (0, 1.29, 0.01)
mydf2 <- data.frame (pos, value)
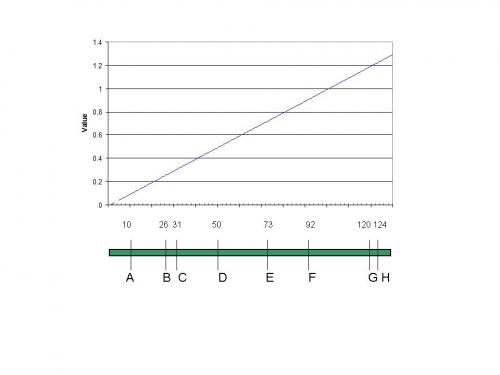
Граф хотят разработать (аналогично или более высокого качества):
Мое испытание
Вот что я попробовал, полный скретч !
yvar <- rep(1, length(position))

require (ggplot2)


bar <- data.frame(y = c(1, 1), x = c(0, 130))
ggplot() +
  geom_line(aes(x, factor(y), group = factor(y)),
            bar, size = 2, colour = "skyblue") +
  geom_rect(aes(y = yvar,
                 xmin = position - 0.1,
                 xmax = position + 0.1,
                 ymin = 1 - yvar /2,
                 ymax = 1 + yvar /2))
1 ответ:
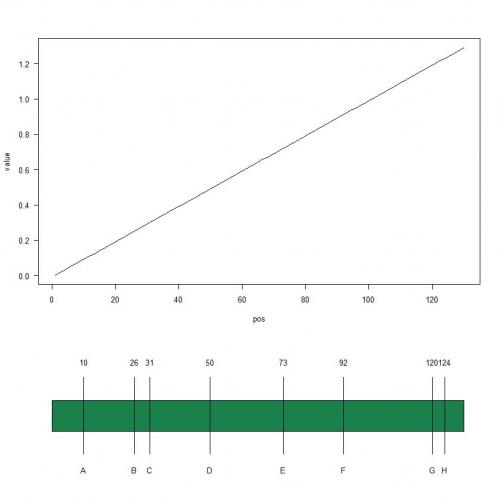
Вот решение с базовой графикой.
# Split the plot area in two
layout(matrix(c(1,1,2),nc=1))
# First plot
plot( pos, value, type="l", las=1 )
# Reduce the margins for the second plot
m <- par()$mar
m[1] <- m[3] <- 0
par(mar=m)
# Set the limits of the second plot
plot( pos, pos-pos, type="n", axes=FALSE, xlab="", ylab="" )
# Add the rectangle, the segments and the text.
polygon(
  c(0,max(mydf2$pos),max(mydf2$pos),0),
  .2*c(-1,-1,1,1),
  col=rgb(.1,.5,.3)
)
segments( mydf$position, -.5, mydf$position, .5 )
text(mydf$position, -.7, mydf$label)
text(mydf$position,  .7, mydf$position)